|
LARGE BLOCK RATIO
Overview
This market sentiment indicator shows the relationship between large block trades, which
are trades of more than 10,000 shares, and the total volume on the New York Stock
Exchange. The comparison of large block trades to total volume shows how active the large
institutional traders are.
The higher the Large Block Ratio, the more institutional activity is taking place. To
smooth out the day-to-day fluctuations, I recommend plotting a 20-day moving average of the
Large Block Ratio.
Interpretation
A high number of Large Block trades in relation to total volume often coincides with market
tops and bottoms. This occurs as institutions recognize the extreme overbought or oversold
conditions of the market and place trades accordingly. Of course, this assumes the
institutions know what they are doing!
Example
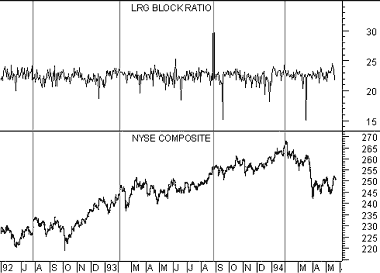
The following chart shows the New York Stock
Exchange Index and the Large Block Ratio.
 I
drew vertical lines when the Ratio was relatively high. You can see that these points
coincided with intermediate-term peaks. I
drew vertical lines when the Ratio was relatively high. You can see that these points
coincided with intermediate-term peaks.
Calculation
The Large Block Ratio is calculated by dividing the number of large block trades by the
total volume on the New York Stock Exchange.

|

