Thomas DeMark's Approach - Part IV - Demarker Indicator
How to determine the strength of the trend: The indicator of Demark (Demarker Indicator)
How to determine the strength of the trend: The indicator of Demark (Demarker)
The formula for DeMarker Indicator is:
Calculating DeMax (i).
If HIGH (i) > HIGH (i - 1), DeMax (i) = HIGH (i) - HIGH (i - 1), otherwise DeMax (i) = 0.
Calculating DeMin (i).
If LOW (i) < LOW (i - 1), DeMin (i) = LOW (i - 1) - LOW (i), otherwise DeMin (i) = 0.
Calculating value of the DeMarker - DMark (i):
DMark (i) = SMA (DeMax, N) / (SMA (DeMax, N) + SMA (DeMin, N)).
Where:
HIGH (i) - the highest price of the current bar;
LOW (i) - the lowest price of the current bar;
HIGH (i - 1) - the highest price of the previous bar;
LOW (i - 1) - the lowest price the previous bar;
SMA - simple moving average;
N - number of periods used for the calculation.
Thus, the DeMarker Indicator based on the following comparisons: if the maximum of the current bar is higher than the maximum price of the previous bar, then the corresponding difference is recorded. If the maximum price of the current bar is equal to or below the maximum of the previous bar, then register a zero value. Then, the differences obtained for the period are summarized. The resulting number becomes the numerator of the Demark Indicator and divided by the same value plus the sum of the differences between the minimum prices of the previous and the current bars for the period.
The DeMarker Indicator is in the range between 0 and 1. Indicator values between 0.7 and 1 form overbought zone, and between 0 and 0.3 - oversold.
Signals of Demarker Indicator:
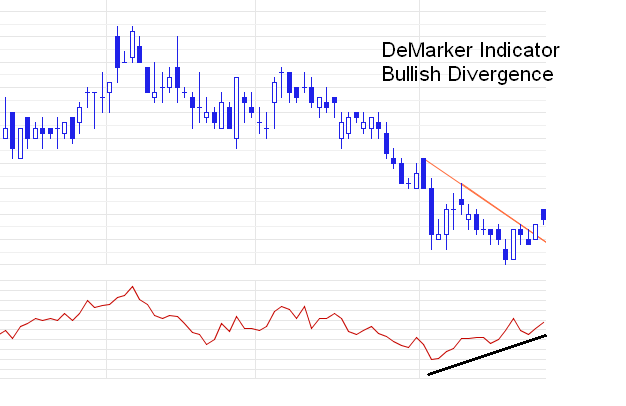
- Bullish Divergence / Bearish Convergence - the main signal indicating the weakness of the current trend (Fig. 1).
- In a flat market exiting overbought (oversold) zone is a signal to sell (buy).
Fig. 1. An example of a DeMarker Indicator bullish divergence.

How to determine the strength of the trend: Overbought / oversold
Thomas Demark singled out two overbought or oversold conditions: extreme and moderate.
Extreme overbought (oversold) occurs when the indicator is in the overbought (oversold) zone more than 5 bars.
Moderate overbought (oversold) occurs when the indicator is in the overbought (oversold) zone less than 5 bars.
If the indicator, fixing the state of the moderate overbought (oversold), came from this area, we expect the bearish (bullish) price reversal.
Exiting the overbought (oversold) zone, after the state of extreme overbought (oversold), as a rule, does not lead to a price reverse. Often, the indicator should come to this area again, fix the state of the moderate overbought (oversold) and a bullish divergence / bearish convergence and leave the area. Only after this trend reversal is possible.
|
 Return to Previous Page Return to Previous Page
|
|

